
Real-time digital signage: live data on your displays.
A display someone updates by hand every morning is out of date the day they forget. Connect a source in Lumicast and the times, figures and lists on the display follow that source. How fast depends on the source: from every minute to every hour, or as soon as your own system sends the data.
Try Team for 14 days. No payment details needed.
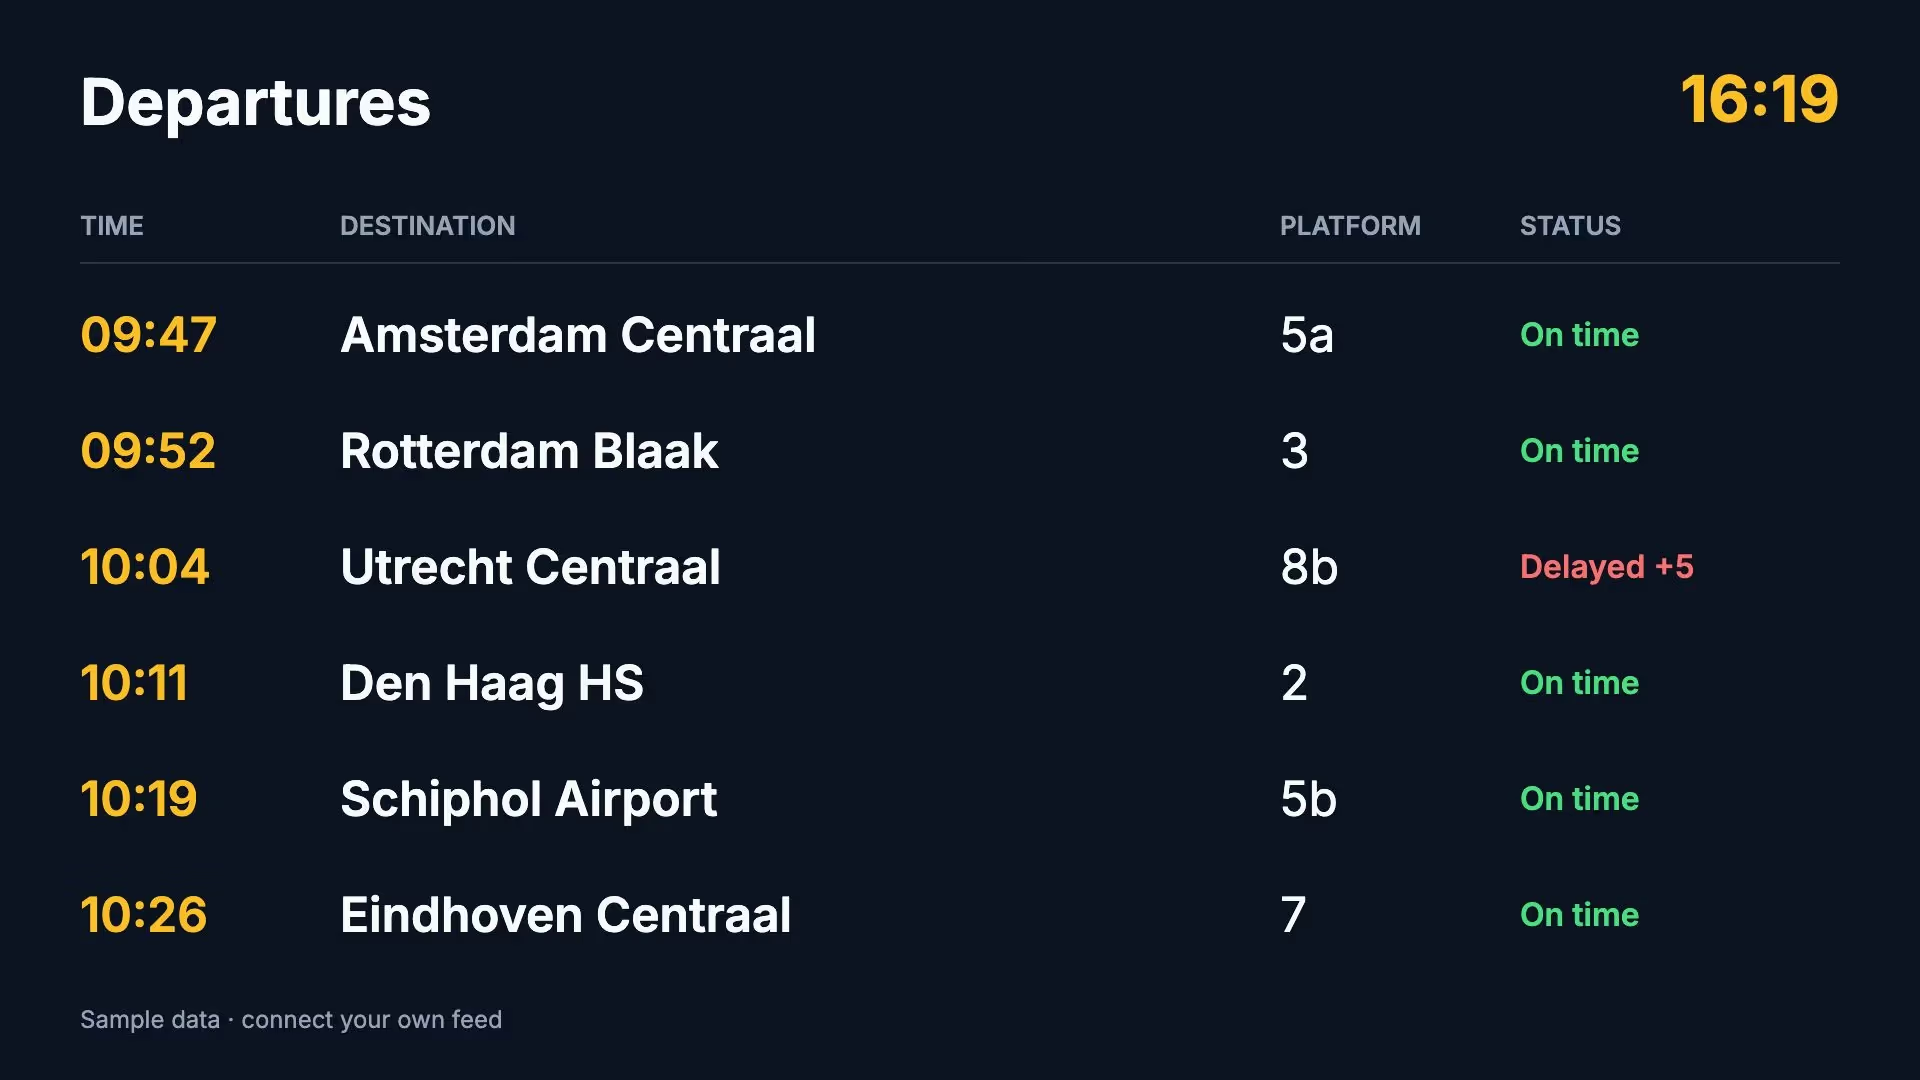
How live data gets onto your display
You set it up once. After that, Lumicast fetches the data itself and your displays always show the latest values.
Connect a source
Create a data source and choose a ready-made integration, your own API, a webhook, an RSS feed or an iCal calendar. Or fill in the rows yourself, with no connection at all.
Put a field in your design
Type / in a text layer and pick the field from your data source. For a list, repeat a group once per row, for example for the next five trains.
Let Lumicast refresh it
Lumicast fetches the data at the interval you choose and keeps the latest values. For each data source you can see when it was last updated and whether it is still up to date.
Where does the data come from?
Lumicast has ready-made integrations for common sources and a general route for anything with a web address or a webhook.
No account needed
These sources ask for no sign-in. You only choose what to show.
- Weather
- Train departures (NS)
- Traffic (Netherlands)
- News
- Sunrise and sunset
- RSS feeds
Your own lists
Prices, shifts, announcements: whatever you keep in a table today, you connect to a design.
- Google Sheets →
- Airtable →
- SharePoint →
- Fill in yourself or import a CSV
Calendars and timetables
Who is in today, which lesson is cancelled, what starts at 2 pm.
- Google Calendar
- iCal calendars
- Zermelo →
Figures and team tools
The numbers that matter, large on a display in the corridor or on the production floor.
- Power BI →
- Microsoft Teams
- Jira
- GitHub and GitLab
- Stripe
- Linear
- Sentry
- Plausible
Your own system
Have Lumicast fetch a web address that returns JSON, with headers such as a token, or have your system send the data itself. You choose which fields of the JSON to use.
- API polling
- Webhook
- Signed requests
How real-time is real-time?
Lumicast asks a source at a fixed interval. It is not a stream that refreshes every second, and a display in a corridor or waiting room does not need one to stay current. These are the defaults per source.
| Source | Refresh |
|---|---|
| Train departures (NS) | Every minute |
| Traffic (Netherlands) | Every minute |
| News | Every 5 minutes |
| Google Sheets | Every 5 minutes; you can choose from every minute to every hour |
| Airtable, Power BI and SharePoint | Every 5 minutes |
| Weather | Every 15 minutes; you can choose up to every hour |
| Sunrise and sunset | Every hour |
| Your own API, RSS and iCal | The interval you set |
| Webhook | As soon as your system sends the data |
A source is never more current than it is itself. If a Power BI model refreshes every hour, you see new figures every hour, however often Lumicast asks.
Templates for live data
These templates come with example values. Connect a data source and replace the example values with fields from your source.
See all templates →
In depth, per source
For these sources we wrote a guide of their own, with what you can show and how to connect it.
What do you need?
Data sources are part of Team. You try them for 14 days with your own source, no payment details needed. After that you pay per display per month.
€20 per display per month
Billed yearly; €25 billed monthly. All prices exclude VAT.
Compare plans →Questions about live data
Is it really real-time?
Nearly. Lumicast asks your source at a fixed interval, for most integrations anywhere from every minute to every hour. If you want new data the moment it exists, your own system can send it to Lumicast with a webhook. It is not a stream that refreshes every second.
Can I combine several sources on one display?
Yes. Each field in your design chooses which data source it comes from. One page can show the NS trains, the weather and a notice from your spreadsheet.
Can I connect my own system?
Yes. With API polling, Lumicast fetches a web address that returns JSON, with headers such as a token. With a webhook, your system sends the data itself, and you can require signed requests for that. In both cases you choose which fields of the JSON to use.
Do I need technical knowledge?
Not for the ready-made integrations: you connect the service and choose what to show. For your own API or webhook you need someone who knows your system.
What happens if the source or the internet goes down?
The display keeps showing the latest data it received. If that is well past its refresh time, the display says the content may not be up to date. In the overview of your data sources you see for each one whether it is up to date, stale, paused or failing. If a connection has expired, you reconnect it.
Which plan do I need?
Team. It is also part of the 14-day trial, without payment details. If you choose no plan afterwards, the displays stop playing. Your workspace and content are kept.
Put the first live value on your display.
Connect your own source during the trial and see how your data looks from a distance. Questions about an integration? We will think along with you.
Try Team for 14 days. No payment details needed.